Blog
Win Rate Is a Lagging Indicator. What Is Your Leading One?
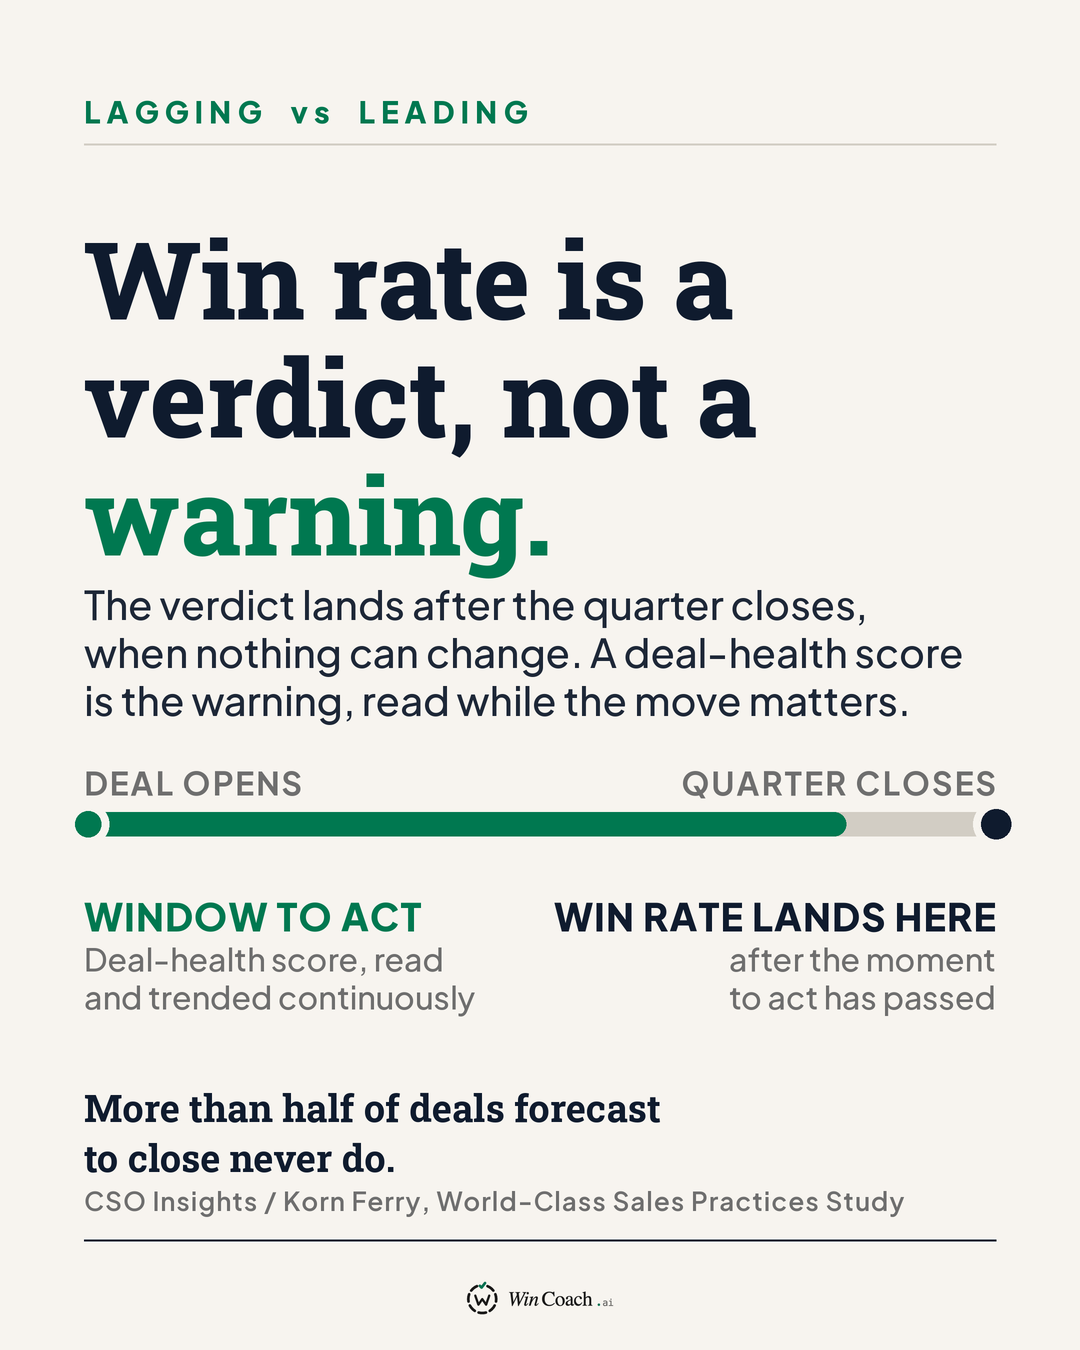
Win rate is a number every sales leader watches and it can do the least for you. By the time win rate moves, the deals that moved it are already decided. It is a result , not a signal . The useful question is not “What i
- Win rate is a number every sales leader watches - and it can do the least for you.
- By the time win rate moves, the deals that moved it are already decided.
- It is a result, not a signal.
- The useful question is not “What is my win rate?” but “What is my leading indicator - the thing that tells me a deal is in trouble while I can still act?”
What win rate is (and why it’s late)
- Win rate = closed-won deals ÷ total decided deals, calculated after the period ends.
- It’s honest - and lagging.
- It tells you the verdict on deals that are already won, lost, or dead.
- It cannot tell you what will slip next month, because those deals have not resolved yet.
The problem behind the problem
- Forecast accuracy is poor enough that leaders quietly distrust it.
- Teams end up staring at numbers that are either:
- lagging (win rate), or - intended to be leading (forecast), but wrong often enough to be unreliable.
The hidden cost in a familiar pipeline scenario
- A deal “looks healthy” because activity is high:
- multiple demos - a security review - new stakeholders added - a champion saying the right things
- It sits in commit and the forecast carries it.
What happens
- Quarter ends and it doesn’t close.
- It doesn’t go to a competitor — it stalls.
Why it happens
- The buyer can’t get the decision over the line internally.
- The “safest” option becomes no decision.
- The manager learns this at quarter close from the win-rate line.
- The coaching that might have changed the outcome arrives a quarter too late.
- Teams measure constantly - but they measure the wrong things.
- Activity (demos, meetings, stakeholder counts) feels like progress, but it is an input, not a leading indicator.
- High activity + a stalled decision is often the exact pattern that ends in no decision.
What a real leading indicator looks like
- A leading indicator is a structured read of winnability, taken early enough to act.
The fix (independent of any product): an early, structured, trended winnability assessment
- Structured: the same dimensions are scored on every deal (comparable, not anecdotal).
- Early: scored from the first real signals, not only at proposal stage.
- Complete: draws on the whole deal team’s knowledge, not just what the CRM happened to log.
- Trended: tracked over time, because the movement is often the message.
Why trending matters
- A deal dropping from healthy to fragile over two weeks signals risk that a static score won’t.
- Across the portfolio, declining scores can surface risk weeks before win rate confirms it.
How WinCoach fits
- The deal team captures what it knows in plain language
- A proprietary framework of 28 dimensions across seven pillars of winnability evaluates the signals.
- The outputs (by role are)
- Seller: what to do today - Manager: the conversation to have in the 1:1 and who to coach - Leader: where the quarter really stands and where to engage
How WinCoach differs from adjacent tools
- Forecast tools: give a score.
- Conversation intelligence: tells you what was said.
- CRM AI: summarises the record.
- WinCoach: uses a structured framework, draws on whole-team signals, and produces role-aware guidance.